

Bitcoin remains trapped in a broad corrective structure, with the price currently near $64.3K after failing to reclaim several important resistance levels. The daily chart shows a persistent bearish trendline and weakening momentum, while the 4-hour structure suggests that the asset is compressing inside a narrowing range. Meanwhile, NUPL has fallen sharply from cycle-high territory, indicating that aggregate unrealized profits have been significantly reduced.
Bitcoin Price Analysis: The Daily Chart
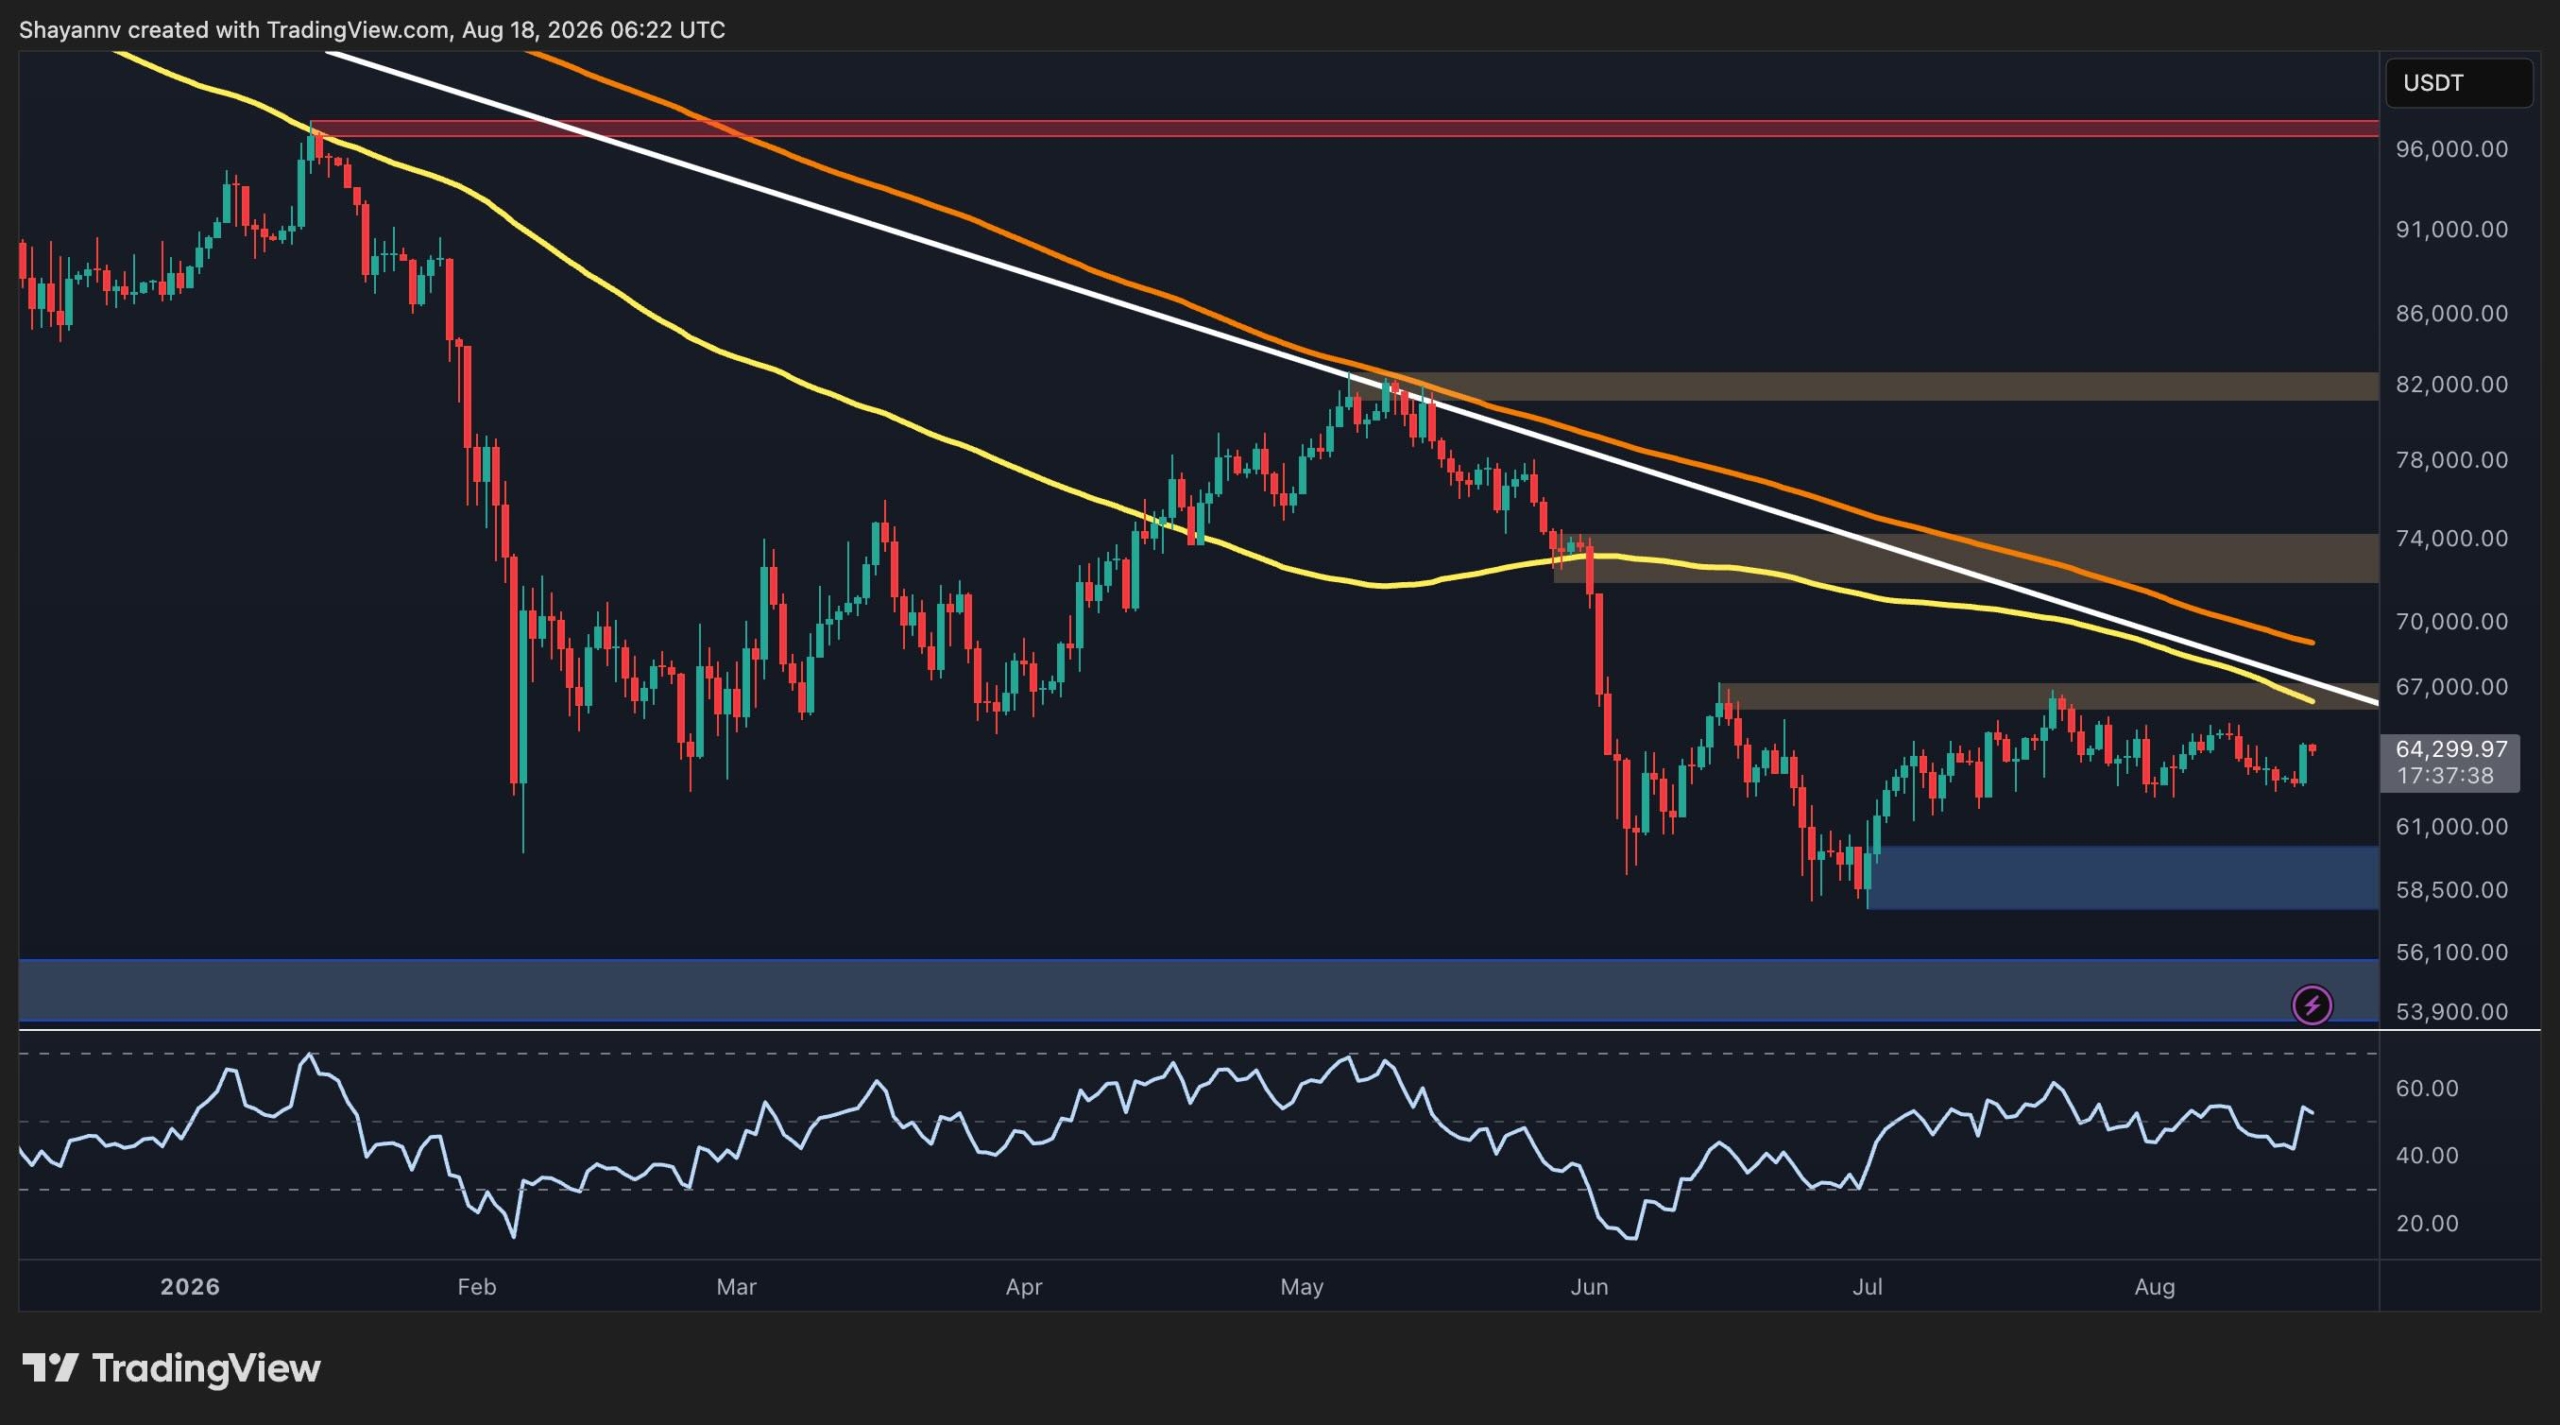
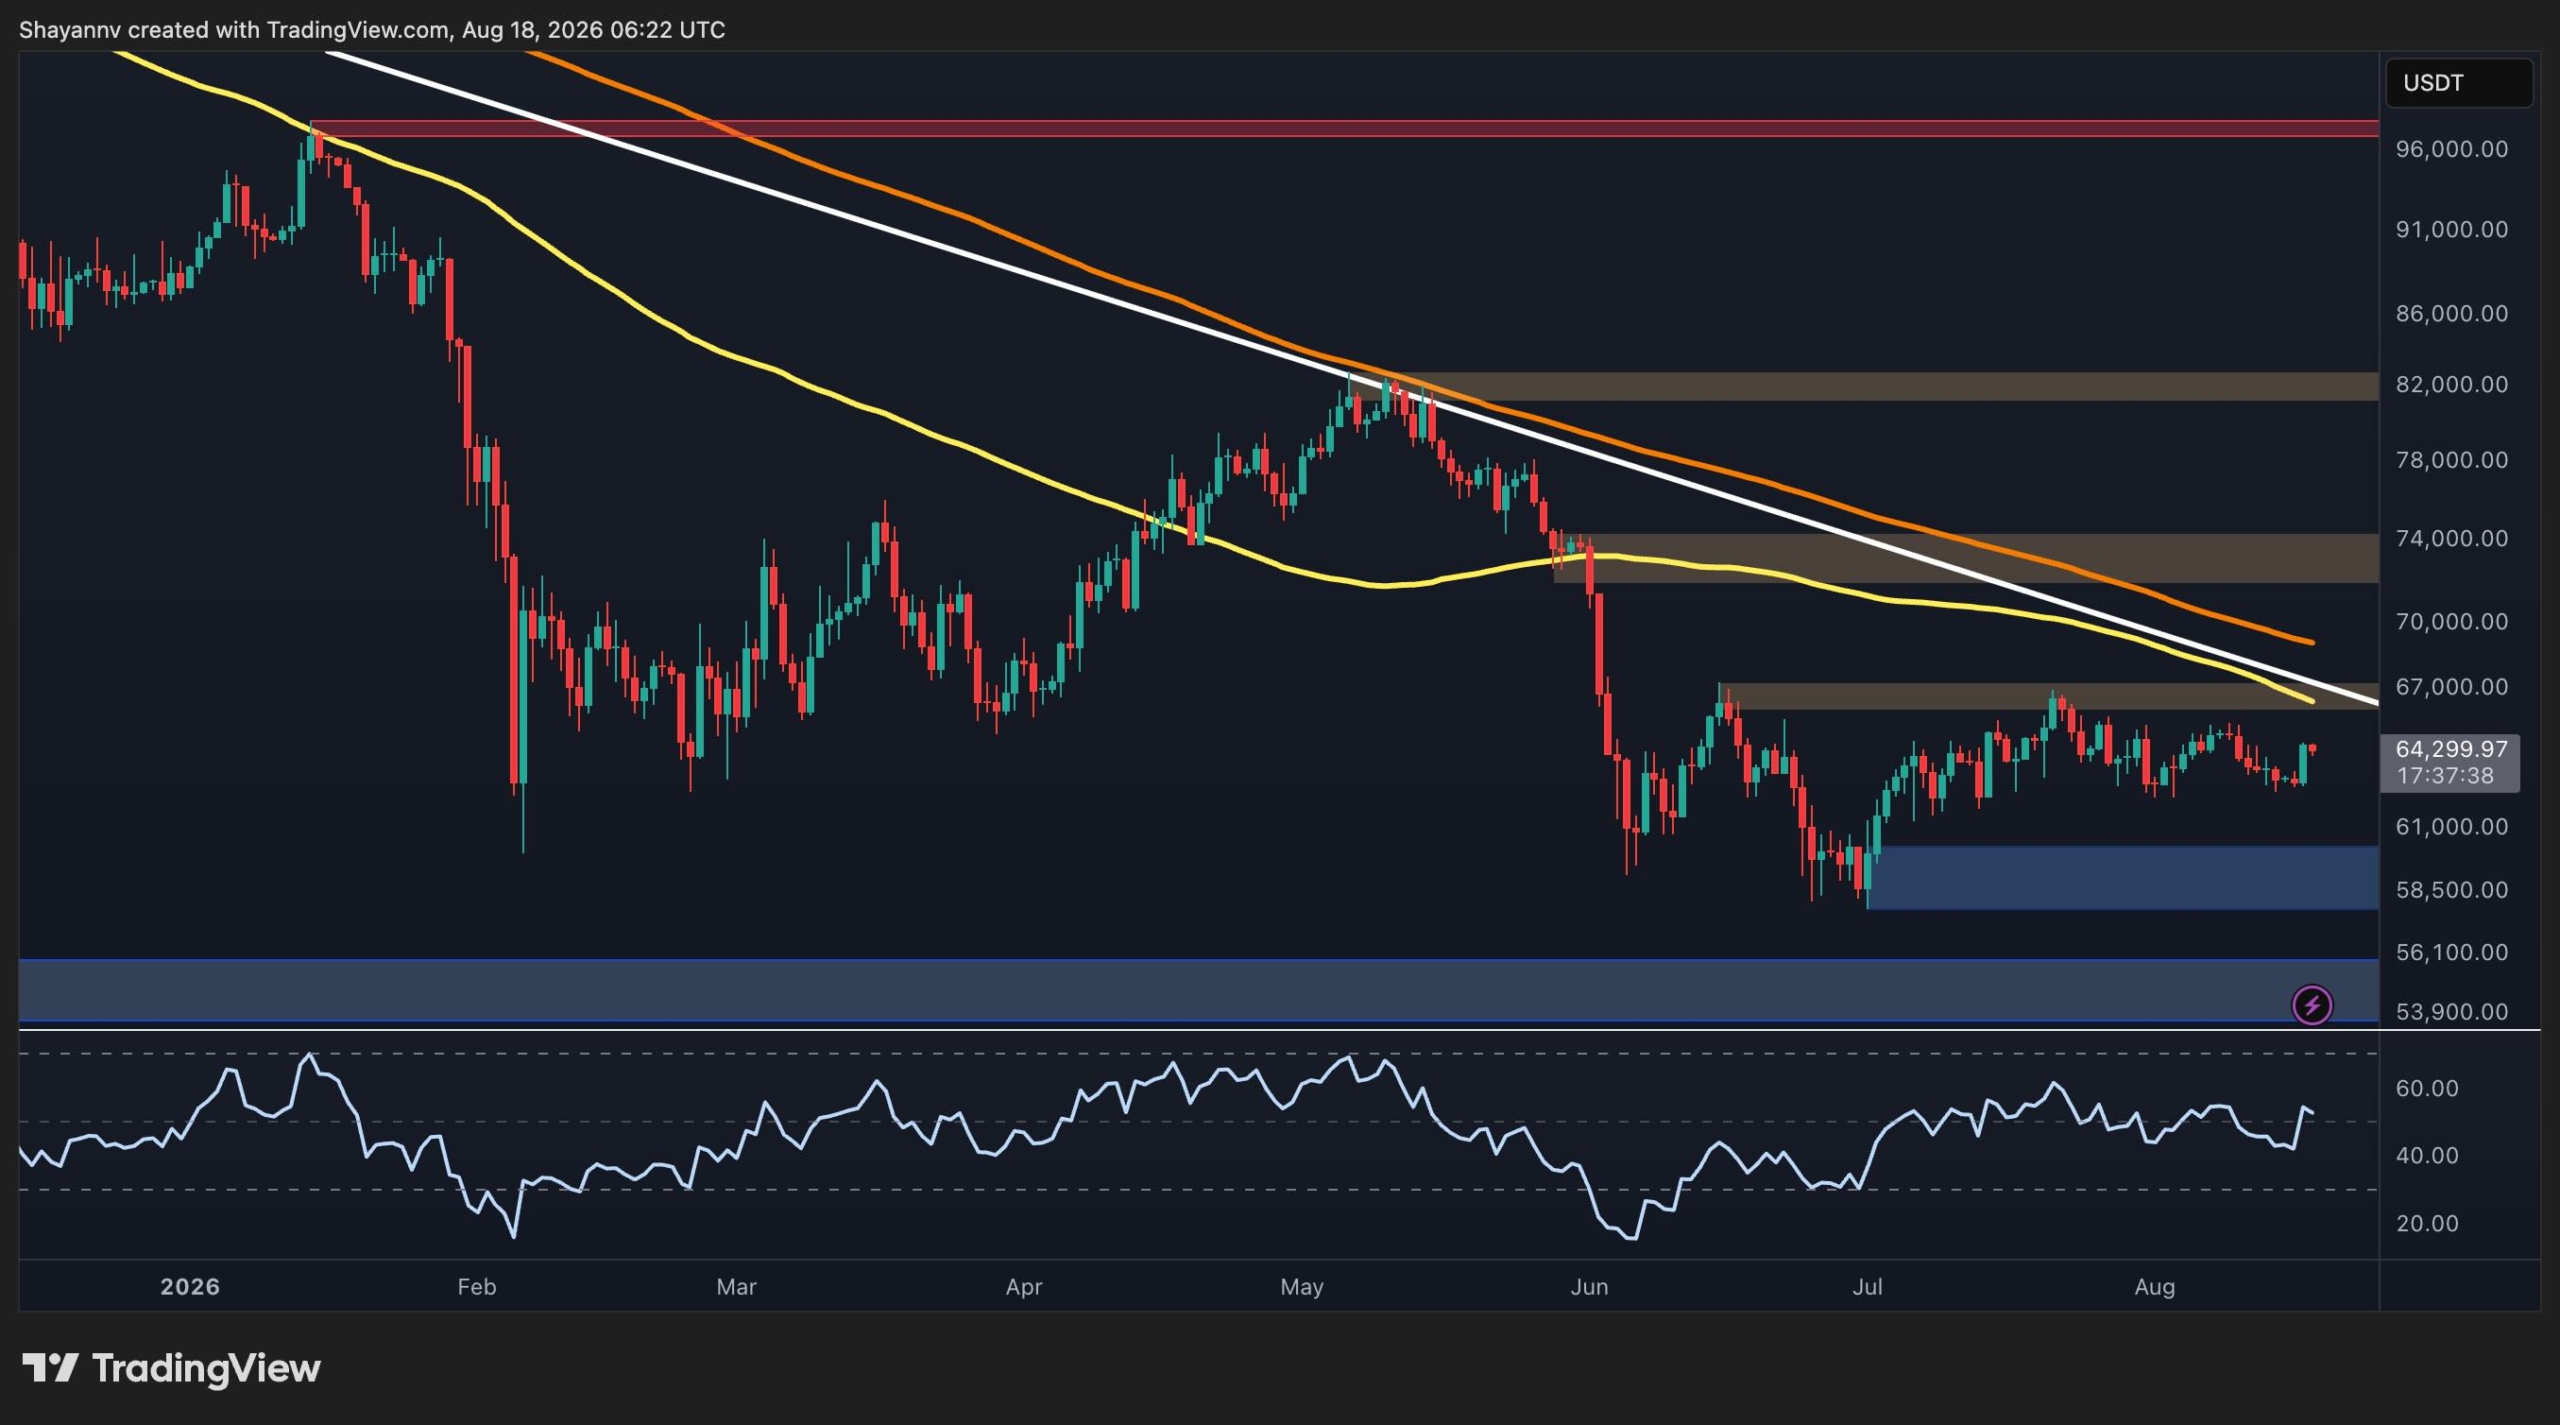
Bitcoin’s daily chart remains technically cautious. The price is trading below the descending white trendline and the 100-day and 200-day moving averages. This alignment keeps the broader trend tilted to the downside until BTC can reclaim these dynamic resistance levels.
The most immediate horizontal resistance sits around the $67K zone, where the descending trendline and a horizontal supply area converge. A daily breakout above this region would be an important improvement in market structure and could open the way toward the $72K-$74K resistance zone. Above that, the $82K area represents another major supply region.
On the downside, BTC is currently holding above the $60K demand zone. A loss of this area would weaken the consolidation structure and could expose the deeper $55K support region. Therefore, the $60K zone remains particularly important for the bullish case.
BTC/USDT 4-Hour Chart
The 4-hour chart provides a somewhat more constructive short-term picture. BTC has been forming a tightening symmetrical triangle structure between an ascending lower trendline and a descending upper trendline, effectively creating a compression pattern.
The price is currently near $64.3K, approaching the upper boundary of this structure. The first major hurdle is the $66K-$67K resistance zone, which also coincides with the longer-term descending channel. A decisive breakout above this region would favor a continuation toward the key $72K area.
Conversely, a breakdown of the triangle pattern from the upper trendline could send BTC back toward the $60K area rapidly. The 4-hour RSI has also surged toward the upper end of its recent range, showing a clear improvement in short-term momentum. However, the indicator is also approaching overbought territory, meaning a rejection near resistance could trigger another pullback before a breakout attempt.
Overall, a compression structure is usually resolved with an impulsive move, depending on the direction of the subsequent breakout. Therefore, the upcoming sessions can be crucial in determining BTC’s trend in the short-term.

On-Chain Analysis
The NUPL chart shows a significant deterioration in Bitcoin’s unrealized profit conditions. NUPL has fallen from above 0.5 during the earlier stages of the cycle to approximately 0.18 currently. The indicator is therefore sitting well below the 0.25 level highlighted on the chart and close to the lower end of the historical range shown.
This decline indicates that the aggregate unrealized gains held by Bitcoin investors have been substantially compressed. Importantly, the current NUPL reading is much closer to the capitulation/low-profit regions seen during previous major corrections than to the elevated levels associated with euphoric market conditions.
While NUPL data does not support a euphoric late-cycle interpretation at present, it also does not provide a standalone bullish signal. The technical charts still need to confirm a structural recovery, particularly through a breakout above $67K and the long-term descending trendline.

The post Bitcoin Price Analysis: BTC’s Rally Means Nothing Until It Reclaims This Key Level appeared first on CryptoPotato.
Bitcoin remains trapped in a broad corrective structure, with the price currently near $64.3K after failing to reclaim several important resistance levels. The daily chart shows a persistent bearish trendline and weakening momentum, while the 4-hour structure suggests that the asset is compressing inside a narrowing range. Meanwhile, NUPL has fallen sharply from cycle-high territory, indicating that aggregate unrealized profits have been significantly reduced.
Bitcoin Price Analysis: The Daily Chart
Bitcoin’s daily chart remains technically cautious. The price is trading below the descending white trendline and the 100-day and 200-day moving averages. This alignment keeps the broader trend tilted to the downside until BTC can reclaim these dynamic resistance levels.
The most immediate horizontal resistance sits around the $67K zone, where the descending trendline and a horizontal supply area converge. A daily breakout above this region would be an important improvement in market structure and could open the way toward the $72K-$74K resistance zone. Above that, the $82K area represents another major supply region.
On the downside, BTC is currently holding above the $60K demand zone. A loss of this area would weaken the consolidation structure and could expose the deeper $55K support region. Therefore, the $60K zone remains particularly important for the bullish case.
BTC/USDT 4-Hour Chart
The 4-hour chart provides a somewhat more constructive short-term picture. BTC has been forming a tightening symmetrical triangle structure between an ascending lower trendline and a descending upper trendline, effectively creating a compression pattern.
The price is currently near $64.3K, approaching the upper boundary of this structure. The first major hurdle is the $66K-$67K resistance zone, which also coincides with the longer-term descending channel. A decisive breakout above this region would favor a continuation toward the key $72K area.
Conversely, a breakdown of the triangle pattern from the upper trendline could send BTC back toward the $60K area rapidly. The 4-hour RSI has also surged toward the upper end of its recent range, showing a clear improvement in short-term momentum. However, the indicator is also approaching overbought territory, meaning a rejection near resistance could trigger another pullback before a breakout attempt.
Overall, a compression structure is usually resolved with an impulsive move, depending on the direction of the subsequent breakout. Therefore, the upcoming sessions can be crucial in determining BTC’s trend in the short-term.
On-Chain Analysis
The NUPL chart shows a significant deterioration in Bitcoin’s unrealized profit conditions. NUPL has fallen from above 0.5 during the earlier stages of the cycle to approximately 0.18 currently. The indicator is therefore sitting well below the 0.25 level highlighted on the chart and close to the lower end of the historical range shown.
This decline indicates that the aggregate unrealized gains held by Bitcoin investors have been substantially compressed. Importantly, the current NUPL reading is much closer to the capitulation/low-profit regions seen during previous major corrections than to the elevated levels associated with euphoric market conditions.
While NUPL data does not support a euphoric late-cycle interpretation at present, it also does not provide a standalone bullish signal. The technical charts still need to confirm a structural recovery, particularly through a breakout above $67K and the long-term descending trendline.
The post Bitcoin Price Analysis: BTC’s Rally Means Nothing Until It Reclaims This Key Level appeared first on CryptoPotato.

