


A Septennial Analysis Of Pre-Collapse Macroeconomic Indicators
Authored by Milan Adams via Preppgroup,
Walk through any downtown financial district in mid-September 2026 and you’ll see the same strange disconnect. Construction crews still raise glass towers. Restaurants at noon remain packed with expense-account lunches. Bespoke tailors on side streets measure suits for clients who haven’t yet noticed their foundations shifting.
Surface-level appearances suggest continuity, even prosperity. Yet beneath this maintained facade, data streams flowing from Treasury servers, credit bureaus, and trading floors tell a markedly different story – one of accumulating strain that policy statements cannot wish away.

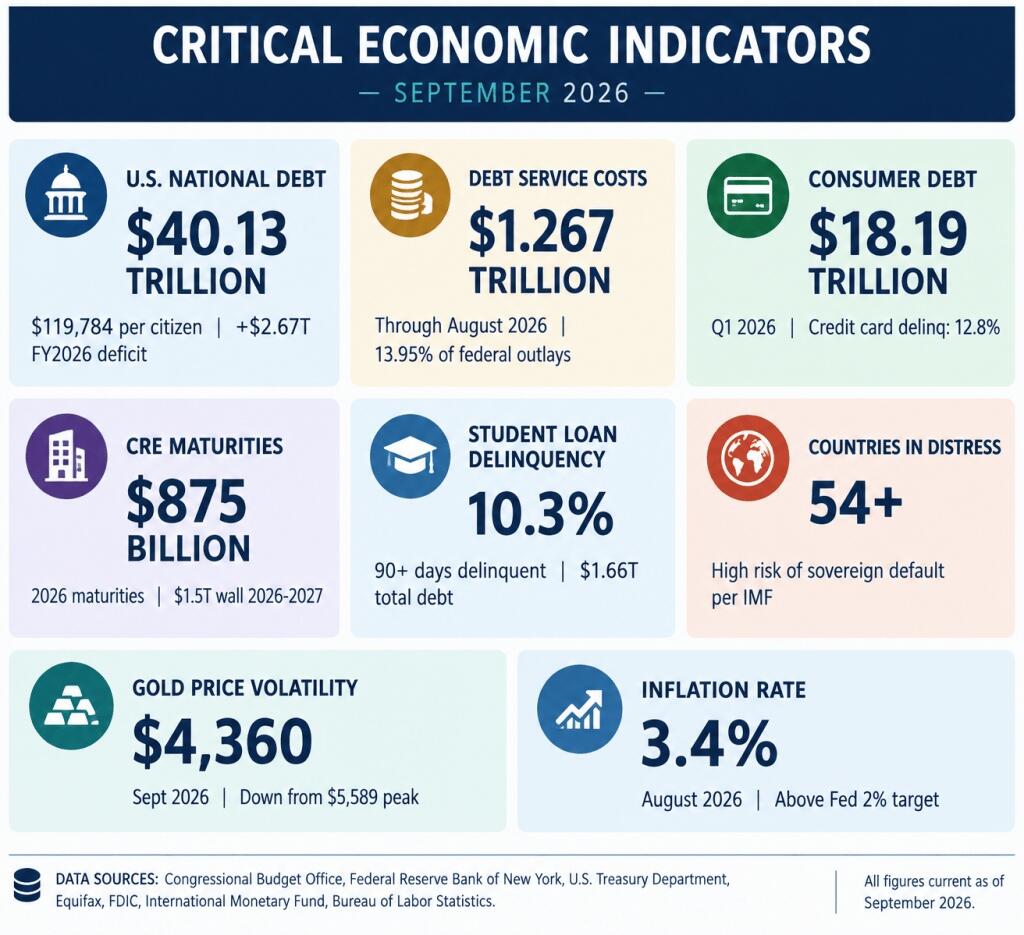
By September 8, 2026, United States federal debt reached $40.13 trillion. That figure translates to roughly $119,784 owed by every man, woman, and child in the country, a burden that would have seemed absurd to discuss seriously even fifteen years ago. More immediately concerning than the nominal amount is the speed at which carrying costs are escalating. Through August of fiscal 2026, gross interest payments on public debt hit $1.267 trillion – a record pace that consumes resources otherwise available for infrastructure, education, or research.
Congressional Budget Office projections now show net interest consuming 13.95% of all federal outlays in FY2026, rising to 14.25% in FY2027 and approaching 15% by FY2028. Nearly fifteen cents of every dollar spent serves not current needs but past obligations. That reallocation, gradual enough to escape daily headlines, nonetheless represents a fundamental shift in how America deploys its collective resources.
Several interconnected developments, examined together, illuminate why September 2026 marks a particularly precarious moment:
-
Sovereign Debt Saturation: Federal obligations exceeding 120% of GDP, with interest costs creating self-reinforcing cycles where new borrowing pays old debt service
-
Household Financial Distress: Consumer debt at $18.19 trillion as of Q1 2026, with delinquency rates in multiple categories approaching levels last seen during the 2008 crisis
-
Commercial Real Estate Deterioration: Approximately $875 billion in mortgages maturing during 2026 against depressed occupancy and valuation fundamentals
-
Currency Instability Signals: Gold prices swinging violently between $4,360 and $5,589, indicating deep uncertainty about fiat stability
-
Emerging Market Fragility: Over 54 nations currently in or near debt distress per IMF assessments, raising contagion risks
How the Debt Trap Springs Shut
Federal fiscal dynamics in 2026 reveal mechanics that compound faster than political timelines can address. That $40.13 trillion figure becomes genuinely alarming when viewed through debt-sustainability analysis. Average interest rates on marketable national debt reached 3.475% by August 2026 – substantially above the near-zero rates that prevailed through much of the pandemic period.
With debt stocks exceeding annual output by over twenty percentage points, even modest rate increases generate exponential service requirements. CBO forecasts $16.2 trillion in net interest payments across the coming decade, climbing from $1.0 trillion in 2026 to $2.1 trillion by 2036. At those levels, debt service crowds out virtually all discretionary spending.
Compounding works insidiously. Maturing debt rolls over at higher rates. Treasury auctions must attract sufficient participation to refinance existing obligations plus fund new deficits. Bid-to-cover ratios for four-week bills stood at 2.97 in August 2026 – technically adequate, yet vulnerable to sentiment shifts. Foreign holdings have grown concentrated and potentially volatile; Russia substantially reduced Treasury exposure, while other nations diversify reserves away from dollar assets.
Fiscal year 2026 deficits will likely exceed $2.67 trillion according to Joint Economic Committee data released September 8. That imbalance isn’t temporary cyclicality but structural feature. Tax revenues, constrained by legislative gridlock and sectoral stagnation, fail to match expenditure growth driven by entitlements, defense commitments, and – ironically – debt service itself. Each year’s deficit adds to debt stock, which raises next year’s service costs, which widens future deficits.
Penn Wharton Budget Model estimates suggest U.S. federal debt cannot rationally exceed roughly 210% of GDP as an outer limit – a threshold that current healthcare cost growth could reach within two decades. Markets typically impose discipline well before theoretical limits. When confidence erodes sufficiently, crisis arrives suddenly.
Kitchen Tables Buckling Under Weight
Sovereign debt attracts political attention, yet household balance sheets show equally troubling patterns. Consumer debt reached $18.19 trillion in Q1 2026 according to Equifax data released May 28. That aggregate – encompassing credit cards, auto loans, student debt, and other obligations – masks severe distributional stresses threatening both individual welfare and aggregate demand.
Credit card delinquencies have risen to levels unseen since 2008-2009. Between Q3 2022 and Q1 2026, balances 90+ days delinquent jumped from 7.6% to 12.8%. Federal Reserve Bank of New York data from August 2026 shows these transition rates into serious delinquency remain elevated even as headline economic growth appears stable.
Student loans present particularly intractable challenges. Total outstanding: $1.66 trillion as of Q1 2026. Payment resumption following pandemic forbearance generated severe adjustment shocks. Delinquency rates hit 10.3% of balances 90+ days past due in Q1 2026, up from 9.6% in Q4 2025, with further deterioration expected as temporary relief expires. Unlike other debt categories, student loans cannot be discharged through bankruptcy, creating permanent drags on borrower capacity.
Auto loan delinquencies reached unprecedented highs per FRBNY data from May 2026. Behind these numbers lie structural conditions, not individual mismanagement: vehicle price inflation during 2021-2023, subsequent rate increases raising monthly payments, and wage growth failing to match cost-of-living adjustments.
Housing markets compound pressures. Mortgage rates near 6.57% in Spring 2026 – down from 2023 peaks but far above 3% rates many homeowners locked in during refinancing booms – created “rate lock-in” effects freezing turnover. Supply constraints maintain prices excluding first-time buyers. Joint Center for Housing Studies at Harvard data shows units affordable to households earning $75,000 or less dropped 60% from March 2019 to March 2026, creating generations of permanent renters or multi-generational households.
Consumer credit cycles enter dangerous phases when households exhaust pandemic-era savings and increasingly rely on credit to maintain consumption patterns. Rising delinquencies prompt lenders tightening standards, reducing availability precisely when households need it most. Such procyclical dynamics amplify downturns.
Empty Towers, Broken Loans
Commercial real estate illustrates delayed crisis dynamics perhaps better than any other sector. A $1.5 trillion “debt wall” approaches in 2026-2027 – loans originated during 2019-2021 low-rate environments now requiring refinancing at substantially higher costs. Approximately $875 billion in commercial and multifamily mortgages mature during 2026 alone. Borrowers face debt service coverage ratio trips, cash management challenges, and carve-out exposure threatening equity positions.
Office properties constitute epicenters. Hybrid work arrangements, initially viewed as temporary pandemic adaptations, proved structurally durable. Central business district occupancy remains 30-40% below pre-pandemic norms in many major markets, rendering obsolete vast Class B and C office inventories. Valuation compression has been severe; some metropolitan office markets saw price declines exceeding 50% from 2019 peaks.
Banking system exposure creates systemic vulnerabilities. Regional banks hold disproportionate commercial real estate loan shares relative to money center institutions, facing capital erosion as losses mount. By June 2026, nearly $37 billion in commercial real estate loans – 1.17% of all bank-held loans – were delinquent. While below 9% post-2008 levels, trajectories concern regulators and market participants.
Federal Reserve stress testing identifies commercial real estate concentration risk as primary regional banking vulnerability. Institutions with exposures exceeding 300% of risk-based capital face heightened scrutiny; several raised capital at distressed valuations or sought strategic alternatives. Metropolitan Bank’s failure in early 2026, costing FDIC Deposit Insurance Fund approximately $19.7 million, exemplifies these pressures.
More troubling than realized losses is valuation uncertainty. Transaction volumes collapsed – buyer-seller bid-ask spreads remain too wide for price discovery. Banks face “extend and pretend” incentives avoiding loss recognition. Such dynamics, familiar from Japan’s 1990s experience, transform acute crises into chronic stagnation as zombie assets clog balance sheets and impede credit creation.
Regional banks serve as primary small and medium enterprise credit intermediaries; their impairment threatens employment and investment far beyond real estate markets. 2023’s Silicon Valley Bank, Signature Bank, and First Republic failures previewed dynamics that could recur if commercial real estate losses accelerate.
Gold’s Warning, Dollar’s Contradictions
Monetary instability appears not merely in inflation statistics – August 2026’s 3.4% annual rate, improved from 2022 peaks yet above Federal Reserve targets – but in alternative store-of-value behavior. Gold prices reached record highs above $5,589 in early 2026, then corrected to approximately $4,360 by September, exhibiting volatility signaling deep uncertainty about fiat stability.
Such price action reveals investor ambivalence. Unprecedented gold rallies suggested profound dollar purchasing power and sovereign debt sustainability concerns. Corrections to $4,360 reflected profit-taking and temporary dollar strength, yet continued elevation well above norms indicates persistent non-fiat reserve demand. Central bank gold accumulation continues at rates unseen since Bretton Woods collapse.
Dollar positioning shows similar contradictions. Against major currency baskets, dollar indices show resilience, yet strength masks underlying fragility. Foreign Treasury holdings grew concentrated among allied nations, while strategic competitors systematically reduced exposure. Petrodollar systems underpinning dollar hegemony since the 1970s face structural challenges as energy exporters increasingly accept alternative settlement currencies.
Currency swap arrangements between non-U.S. central banks proliferate, creating parallel payment systems bypassing dollar intermediation. While remaining small relative to global trade volumes, growth trajectories suggest gradual, persistent erosion of dollar network effects. Transitions from unipolar monetary systems to fragmented, multipolar arrangements carry profound fiscal sustainability implications; reserve currency status historically permitted deficit financing at lower costs than otherwise possible.
Cryptocurrency complexes, despite periodic collapses and regulatory crackdowns, continue attracting capital flight from distressed jurisdictions. Bitcoin and Ethereum volatility serves as barometer for traditional monetary arrangement confidence. Continued existence and periodic rallies suggest persistent government-issued currency alternatives demand, even among populations never experiencing developing-nation hyperinflations.
Contagion Beyond Borders
No September 2026 economic analysis completes without examining international dimensions. Modern financial market interconnectedness ensures distress anywhere becomes distress everywhere – transmitted through trade flows, capital movements, and contagion effects defying geographic boundaries.
Over 54 countries currently stand in or near debt distress per International Monetary Fund assessments. That figure, representing over one-quarter of world nations, encompasses economies ranging from small island states to major regional powers. JPMorgan EMBI spreads between emerging-market dollar debt and U.S. Treasuries widened 17 basis points to 268 basis points since late February 2026, with particular stress in Egyptian debt (44 basis point widening) and Turkish obligations (36 basis point increases).
Argentina continues perpetual crisis-stabilization cycles, with inflation moderating from catastrophic levels yet structural vulnerabilities remaining unaddressed. Pakistan and Egypt, heavily dependent upon IMF support and Gulf state beneficence, face refinancing cliffs potentially triggering broader regional instability. World Bank reports indicate 29% of low-income country bonds mature by 2026, creating refinancing walls that could overwhelm available resources if market conditions deteriorate.
Structural shifts in emerging market debt composition offer limited comfort. While many nations reduced foreign currency-denominated obligations – lowering exchange rate shock vulnerabilities – remaining dollar debt concentrates in sectors with limited revenue flexibility. Sovereign borrowers shifting to local currency issuance find themselves paying substantially higher rates, as domestic capital markets demand inflation premia international investors once absorbed.
China’s economic slowdown compounds pressures. As world’s largest trading nation and commodity importer, Chinese demand contraction transmits directly to emerging market exporters. African nations financing infrastructure through Chinese lending face not merely debt service difficulties but export revenue collapses that might otherwise fund obligations. Latin American commodity producers confront simultaneous demand weakness and dollar strength increasing real debt burdens.
Global trade fragmentation into competing blocs – Western, Chinese, and non-aligned – further complicates adjustment mechanisms. Nations can no longer count on export-led growth resolving balance of payments difficulties when major markets impose tariff and non-tariff barriers. World Trade Organization dispute settlement paralysis leaves aggrieved parties without recourse, encouraging unilateral measures compounding fragmentation.
Institutions Showing Wear
Beyond specific debt figures or delinquency rates, 2026 reveals institutional framework degradation that previously stabilized economic fluctuations. Federal Reserve balance sheet expansion to unprecedented pandemic-era levels now confronts impossible trinities: price stability, full employment, and financial stability – with policy choices addressing one objective frequently worsening others.
“Higher for longer” interest rate environments necessary for inflation combat expose vulnerabilities accumulated during near-zero rate decades. Pension funds, insurance companies, and institutional investors extending duration to capture yield now face mark-to-market losses threatening solvency. Liability-driven investment strategies nearly collapsing UK gilt markets in 2022 remain prevalent in U.S. institutional portfolios, creating latent systemic risks.
Shadow banking – non-bank financial intermediation – expanded filling gaps left by regulated institutions subject to post-2008 capital requirements. Private credit funds, direct lending platforms, and fintech-enabled leverage now constitute parallel financial systems whose opacity frustrates risk assessment. When stress emerges in these channels, traditional lender-of-last-resort facilities may prove inadequate or inappropriate.
Labor markets, while showing low unemployment by headline measures, reveal structural deterioration beneath surfaces. Prime-age male labor force participation remains depressed by standards from earlier decades. Gig economies transformed stable employment into contingent arrangements lacking benefits and income predictability. Artificial intelligence adoption, while boosting aggregate productivity, threatens displacement in specific sectors potentially overwhelming retraining and transition support systems.
Demographic headwinds compound challenges. Developed economy population aging strains pension and healthcare systems precisely when debt service requirements escalate. Worker-to-dependent ratios continue declining, threatening tax bases that must support both elderly benefits and debt service. Immigration, which might address labor shortages, faces political opposition constraining policy responses.
“The real problem isn’t any single vulnerability in isolation. It’s how they correlate. When sovereign debt stress, household financial distress, commercial real estate deterioration, and banking fragility hit simultaneously, standard diversification strategies stop working. No asset class thrives when everything else falters. No jurisdiction offers refuge when contagion goes global. We’ve essentially made one big bet – that monetary expansion and fiscal forbearance can continue indefinitely. Eventually, that bet runs into basic arithmetic.”
Reading the Dashboard: September 2026 Data:
Why the Warning Signs Go Unnoticed
Surface-level indicators in September 2026 create strange disconnects. Consumer confidence indices fluctuate yet remain above typical recessionary thresholds. Equity markets, despite volatility, trade near highs by some measures. Unemployment at 4.1% as of August 2026 appears benign.
Several factors explain gaps between quantitative reality and qualitative perception. Asset price inflation during 2020-2021 created substantial wealth effects continuing to support consumption among asset-owning households. Homeowners and equity portfolio holders feel wealthier than underlying conditions suggest, even as renters and non-asset owners face unprecedented affordability constraints.
Normalization of extraordinary monetary policy shifted baseline expectations. Generations of investors and consumers never experienced genuine tightening cycles; brief 2023-2024 rate increases were followed by expectations of renewed accommodation. “Higher for longer” concepts remain psychologically unavailable to market participants building careers during secular interest rate declines beginning in the early 1980s.
Government transfer payments and forbearance programs masked underlying income instability. Student loan payment pauses, mortgage forbearance options, and expanded pandemic-era unemployment benefits created official support expectations that may not sustain. When these programs expire – and many are scheduled for late 2026 and early 2027 – true household balance sheet fragility becomes apparent.
Denial psychology operates institutionally too. Regulatory forbearance allows banks avoiding loan loss recognition. Accounting standards provide asset valuation latitude permitting “mark to model” rather than “mark to market” approaches. Credit rating agencies, chastened by 2008 failures, may overcompensate through excessive issuer optimism.
Collective denial serves short-term functional purposes. If all market participants simultaneously acknowledged vulnerabilities described here, resulting panic would become self-fulfilling. Yet denial costs include postponed adjustment magnifying eventual dislocation. Delayed recognition brings more severe ultimate reckonings.
Sector by Sector: Where the Pressure Builds
Technology, despite artificial intelligence enthusiasm, entered consolidation phases marked by layoffs and valuation compression. “Magnificent Seven” stocks driving 2023-2024 returns showed divergent performance, some facing regulatory challenges, others confronting demand saturation. Venture capital funding contracted dramatically from 2021 peaks, forcing startups into down rounds or closures.
Healthcare costs escalate inexorably, with implications for federal budgets and household finances. Medicare Hospital Insurance trust funds face depletion during mid-2030s under current projections, yet political gridlock prevents structural reforms ensuring sustainability. Pharmaceutical price controls, while popular, may reduce innovation incentives generating mRNA technologies crucial to pandemic responses.
Energy markets exhibit volatility characteristic of transition periods. Renewable capacity additions continue at record rates, yet fossil fuels retain transportation and industrial dominance. Geopolitical supply chain disruptions – whether from Middle Eastern conflicts, Russian sanctions, or shipping interruptions – create price spikes feeding through inflation metrics and consumer sentiment.
Manufacturing, despite reshoring rhetoric, struggles with competitiveness against Chinese and other Asian producers. Domestic production capital intensity, combined with regulatory compliance costs and labor market rigidities, limits industrial recovery pace. Tariffs and trade barriers, while providing temporary protection, raise input costs and invite retaliation harming export-oriented sectors.
Agriculture faces climate-related stresses compounding traditional cyclical challenges. Drought conditions in major producing regions, combined with water rights disputes and input cost inflation, threaten farm profitability and food security. Foreign agricultural land ownership, increasing over 40% between 2016 and 2024 with Chinese entities controlling approximately 384,000 acres, raises national security concerns intersecting economic policy.
Policy Gridlock and Institutional Constraints
Responses to accumulating stresses proved notably inadequate. Monetary authorities, having exhausted conventional tools during previous crises, face constraints limiting new shock responses. Federal Reserve cannot cut rates substantially without reigniting inflation; cannot raise them without triggering debt service crises described earlier. Quantitative tightening reduced balance sheet holdings, yet remaining reserves and securities still represent extraordinary intervention by past standards.
Fiscal policy faces similar constraints. With debt service consuming nearly 14% of federal outlays and projections exceeding 15% within two years, substantial new spending initiatives face automatic opposition from deficit hawks and market vigilantes. Tax increases, while potentially necessary for sustainability, face political opposition making enactment improbable. Results include passive tightening through inflation and bracket creep falling most heavily upon middle-income households.
Regulatory policy oscillates between permissiveness and restriction without coherent strategy. Environmental mandates increase energy-intensive industry costs; financial regulations impose compliance burdens favoring large institutions over regional competitors; labor regulations create rigidities impeding adjustment. Cumulative effects discourage investment necessary for productivity growth.
International coordination broke down precisely when most needed. G20, IMF, and World Bank lack credibility and resources addressing systemic risks transcending national boundaries. Currency wars, trade disputes, and technological competition replaced cooperation characterizing post-2008 crisis management. Each nation pursues narrowly defined self-interest, ignoring collective action problems requiring coordinated solutions.
How Crises Spread
Understanding localized stress becoming systemic crisis requires examining transmission mechanisms. Most obvious channels are financial: losses in one sector force asset sales depressing prices in others, creating mark-to-market losses triggering further forced selling. Reflexivity – described by George Soros – can transform modest corrections into cascading collapses when leverage proves pervasive.
Credit channels operate similarly. Rising delinquencies in one sector prompt lenders tightening standards across all sectors, reducing availability precisely when most needed smoothing consumption and investment. Credit creation’s procyclical nature amplifies business cycles, transforming mild downturns into severe recessions.
Confidence channels prove most dangerous because least susceptible to policy intervention. When economic agents lose future faith, they reduce spending and investment regardless of interest rates or fiscal stimulus. Animal spirit collapses become self-fulfilling as reduced demand generates feared outcomes. Money velocity declines, rendering monetary expansion ineffective.
International transmission occurs through trade, capital flows, and commodity prices. Developed economy recessions reduce emerging market export demand; capital flight from distressed jurisdictions raises global funding costs; commodity price collapses devastate resource-dependent economies. Dollar reserve currency status creates additional complications: dollar strength during crisis periods raises real debt burdens for dollar-denominated borrowers worldwide.
Learning from the Past – Carefully
Students of economic history naturally seek parallels. 1970s stagflation offers lessons about inflation control difficulties once expectations become unanchored, yet today’s debt levels far exceed that era’s. 2008 financial crises demonstrate confidence evaporation speeds, but current vulnerabilities distribute differently – across sovereign balance sheets rather than subprime mortgages. Japan’s 1990s experiences illustrate failure-to-recognize-loss costs, yet Japan’s current account surpluses provided cushions unavailable to contemporary deficit nations.
Each analogue breaks at crucial points. Global integration of modern financial markets, derivative exposure scales, information transmission speeds, and current political fragmentation create unique conjunctures defying simple comparison. Past knowledge provides essential context, yet cannot substitute for present condition analysis.
What history teaches unequivocally: unsustainable trajectories eventually correct. Debt growing faster than income cannot be serviced indefinitely. Asset prices exceeding fundamental values eventually revert. Political systems failing economic challenges lose legitimacy. Correction timing remains inherently unpredictable, dependent upon specific catalysts and confidence thresholds unobservable directly until breached.
Possible Paths Ahead
As 2026 progresses toward conclusion, several scenarios appear plausible, though relative probabilities shift with each data release and policy announcement.
“Soft landing” scenarios, still embraced by official forecasts, assume inflation moderating without triggering recession, debt service costs stabilizing as growth outpaces interest rates, and structural reforms addressing long-term challenges before they become acute. These outcomes, while theoretically possible, require assumptions about productivity growth, demographic adjustment, and political compromise appearing increasingly heroic.
“Stagflationary drift” scenarios envision continued moderate growth accompanied by persistent inflation and gradual living standard erosion. Here, debt service consumes growing national income shares, investment lags depreciation, and each generation finds itself materially worse off than predecessors. Japanification hypotheses applied to the United States – prolonged malaise rather than acute crisis.
“Sudden stop” scenarios involve sovereign debt confidence losses triggering currency crises, capital controls, and emergency austerity. Foreign investors refusing maturing obligation rollovers force either default or monetization generating hyperinflation. These extremes become more probable as debt levels rise and political dysfunction prevents preemptive adjustment.
“Contagion cascade” scenarios begin with shocks in one sector or jurisdiction transmitting globally through financial linkages. Major sovereign defaults, banking system collapses, or geopolitical events trigger reflexive dynamics described earlier, overwhelming policy responses and generating economic contractions exceeding anything since the 1930s.
Each scenario implies different optimal household, investor, and policymaker strategies. Yet uncertainty surrounding which materializes – indeed, possibilities that elements might combine unforeseen ways – paralyzes decision-making and encourages short-termism exacerbating underlying vulnerabilities.
What Comes Next
Analysis presented here suggests 2026’s remainder and 2027’s opening will prove decisive. Milestones loom: fiscal year 2026 conclusions with projected $2.67 trillion deficits; student loan payment full-scale resumption; commercial real estate loan maturities that cannot be refinanced at current rates; and potential geopolitical events disrupting energy markets or trade flows.
Policy responses to these challenges determine whether systems stabilize or deteriorate more rapidly. Technical sovereign obligation defaults remain unlikely immediately; the United States retains reserve currency status and deep domestic capital markets providing financing flexibility unavailable to emerging markets. Yet financing costs – measured in inflation, currency depreciation, or future tax burdens – continue escalating.
Household imperatives center on debt reduction and liquidity maintenance. Variable-rate obligation holders face rising service costs; fixed-rate asset holders benefit from inflation eroding real debt burdens. Monetary policy distributional consequences – favoring asset owners over wage earners – will continue shaping political economy.
Investor challenges involve navigating volatility while preserving capital. Traditional diversification strategies may prove inadequate when correlations converge toward unity during crisis periods. Searches for uncorrelated returns – whether commodities, alternative assets, or geographic diversification – will intensify even as such opportunities become scarcer.
Policymaker windows for preemptive adjustment narrow daily. Structural entitlement program, tax structure, and regulatory framework reforms require political capital dissipating as elections approach and polarization intensifies. Temptations postponing difficult choices – hoping growth resolves arithmetic impossibilities – will prove irresistible until markets impose discipline more painfully than voluntary adjustments would have required.
Final Assessment
September 2026’s economy has not collapsed. Production and exchange machinery continues functioning; most citizens maintain employment and shelter; governance and finance institutions retain forms if not substance. Yet quantitative evidence assembled here – $40 trillion debt, $1.3 trillion interest burdens, 12.8% credit card delinquency rates, $875 billion commercial real estate maturity walls, 54 distressed nations – suggests systems approaching limits that cannot be indefinitely extended.
Questions are not whether adjustments occur, but when and in what forms. Postponements through accounting gimmicks, regulatory forbearance, and monetary accommodation make eventual manifestations more severe. Societies borrowing $2.67 trillion in single years to maintain consumption cannot do so indefinitely. Arithmetic remains inexorable, even when politics refuses acknowledgment.
What emerges from this analysis is not imminent catastrophe prediction but fragility recognition demanding preparation. Specific crisis triggers – whether sovereign defaults, banking panics, currency collapses, or geopolitical shocks – matter less than underlying conditions making such triggers effective. Those conditions are now present to degrees unmatched since 2008, and in certain respects unmatched in modern experience.
Careful observers tracking data without official optimism or partisan narrative filters can see signs. They appear in monthly Treasury statements, quarterly household debt reports, daily credit spread and currency market movements. They accumulate between headline silences, in financial statement footnotes, in budget projection assumptions.
Acknowledging these vulnerabilities is not pessimism surrender but rationality exercise that economic analysis demands. Problem recognition precedes all problem addressing. Evidence presented here suggests recognition is long overdue, and further delay costs will be measured in trillions of dollars and millions of livelihoods. Systems continue running, but those paying close attention can hear the strain.
Tyler Durden
Tue, 09/22/2026 – 21:45

