

K-Shaped Economy: Reality Or Media-Driven Perception
Authored by Lance Roberts via RealInvestmentAdvice.com,
“What the K-shaped economy gets right, what it exaggerates, and what believing the worst version is costing a generation.”
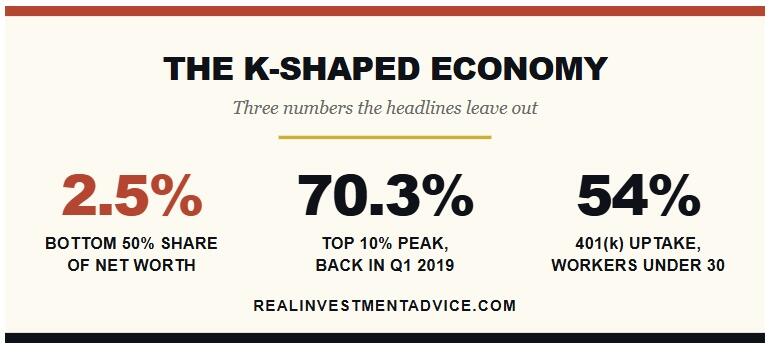
The bottom half of American households owns about 2.5% of the nation’s wealth. That number is real, and it ought to bother you. However, that number is also higher than it was in 2019 and 2015, and roughly six times higher than the 0.4% low it hit in 2011. You will not read that in many places because it doesn’t “fit the narrative.”
Unfortunately, the K-shaped economy headlines have settled into a single unvarying note, and after a while, people stop hearing anything else. I’ve spent the past several weeks working through the underlying data. While there is some truth to the coverage, most of the claims are exaggerated for “clicks and views.” But the psychological damage is clear.
So, before we get into our discussion, here are some numbers for you.
Where The K-Shaped Economy Headlines Are Right
Let me start where the “Persistent Purveyors of Doom” crowd bases its argument, as there is indeed a K-Shaped economy. However, what is critical to understand is that the K-shaped economy is not new. In every economy throughout history, there has always been a K-shaped divide between those at the bottom and those at the top.
Nonetheless, as the headlines suggest, the wage compression of 2020 through 2023 was extraordinary. Autor, Dube, and McGrew documented it in their paper “The Unexpected Compression.” The 90/10 wage ratio fell far enough to reverse roughly a third of forty years of divergence.1 Then it stopped, and worse, it began running the other way.
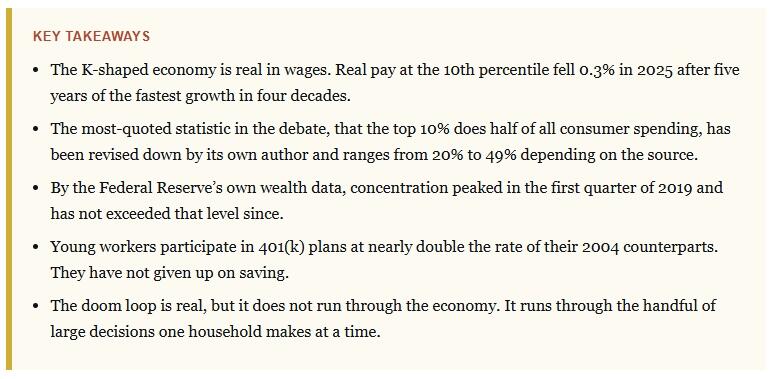
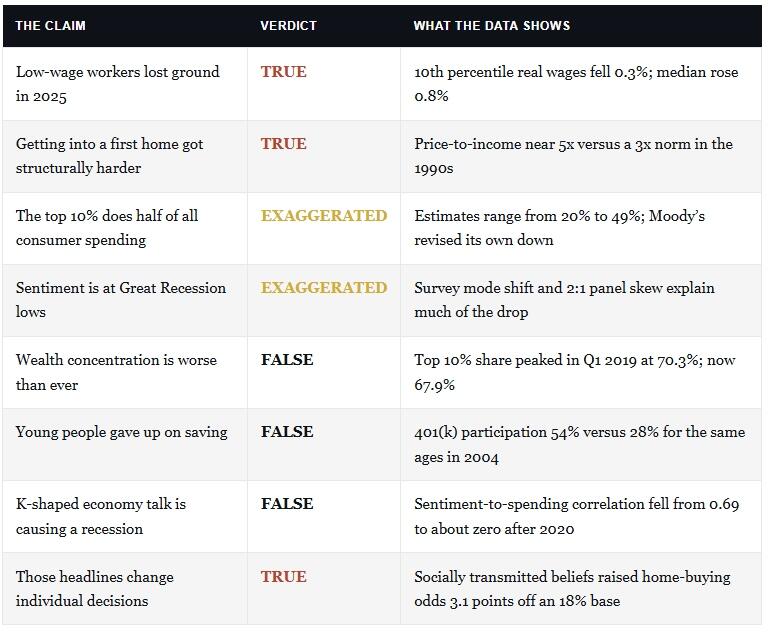
The Economic Policy Institute data for 2025 show that real wages at the 10th percentile fell by 0.3%, while the median rose by 0.8%.2 The lowest-paid workers in America went from the fastest-growing group in the distribution to the only one moving backward.
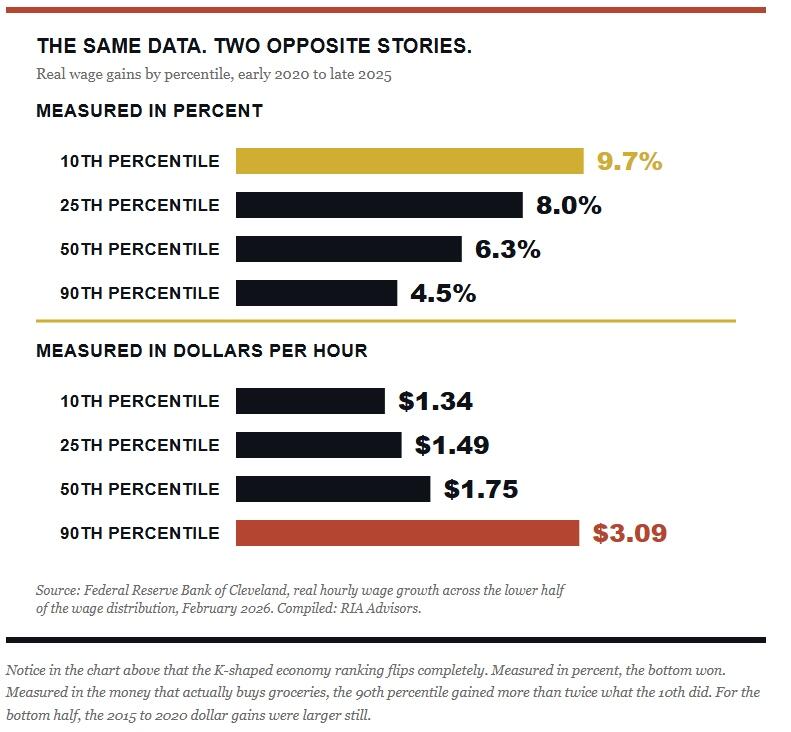
However, the Cleveland Fed adds a detail that should end many K-shaped economy arguments. Between 2020 and late 2025, real wages at the 10th percentile rose 9.7% against 4.5% at the 90th. In dollars, that’s $1.34 an hour against $3.09.3 Percentage compression off a small base is not catching up. And the 2015 to 2020 dollar gains were LARGER at every percentile in the bottom half than the celebrated pandemic-era gains were.
The price level is also crucial to discuss, and is where I think most commentary goes soft. Inflation falling from 9% to 3.4% is a change in the rate, not the level. Since December 2019, consumer prices have risen by roughly 29% and have stayed there. That is a permanent shift in the cost of living, and it is the part of the K-shaped economy argument that sticks, and it hits households with no assets the hardest.
As I’ve written before, “wage growth as a leading inflation indicator” matters for policy. The level is where people actually live. McKinsey asked 30,119 Americans this April, and 60% named the cost of living as one of their top three barriers. That held even with those over $150,000 in income.
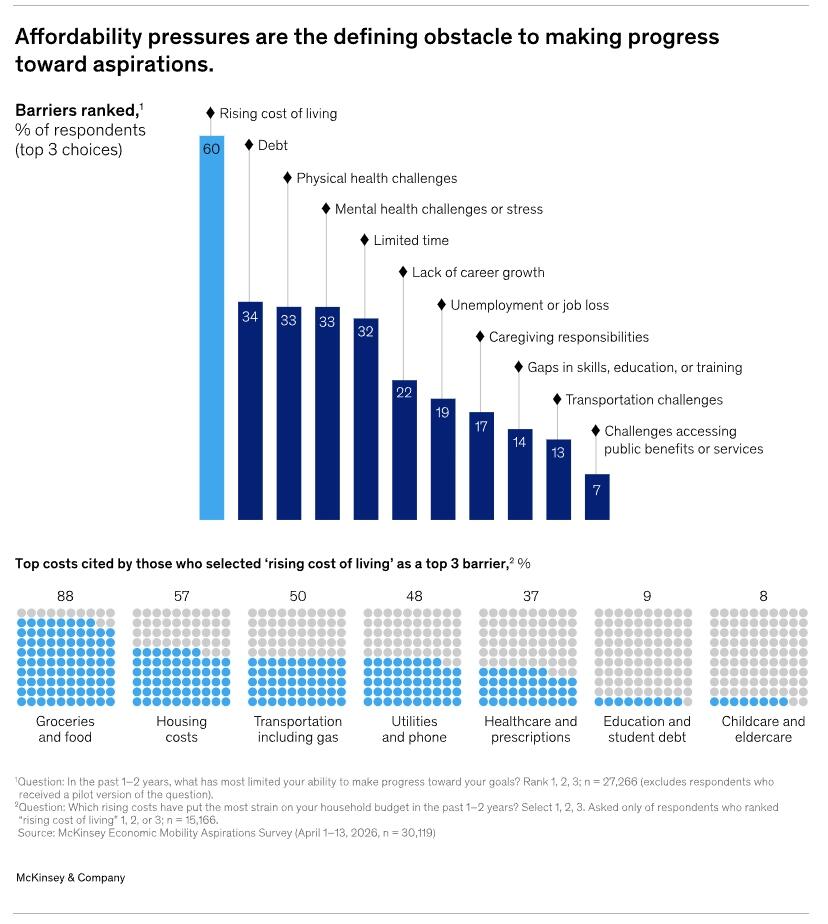
Furthermore, the hiring rate hit 3.1% in February 2026, the lowest reading outside the pandemic, while the share of unemployed workers for 27 weeks or more reached 27.5% in May. Separately, expiration of the enhanced ACA credits pushed average net marketplace premiums up 58% and average deductibles up 37% in a single year.4 That is a real, dated, 2026 hit to exactly the households everyone is arguing about.
The honest summary is that the ladder from the bottom of the K to the top got harder to climb, even as the rungs themselves stopped moving apart.
Where The K-Shaped Economy Headlines Are Exaggerated
The single most repeated statistic in this entire debate, the one anchoring roughly every set of K-shaped economy headlines you have scrolled past this year, is that the top 10% of earners account for about half of all consumer spending.
It comes from Moody’s Analytics. The number is shakier than it looks. Moody’s revised its own estimate down from 49.2% to 45.8% after a methodology change, and Mark Zandi told reporters plainly that he “wouldn’t die on the hill of the top 10% accounting for 45% of the spending.”5 Berkeley’s Antoine Levy points out the arithmetic problem: the top decile takes home 35% to 40% of disposable income and saves a fifth of it, so its spending share cannot be half. The BLS Consumer Expenditure Survey puts the figure at 22.9%.
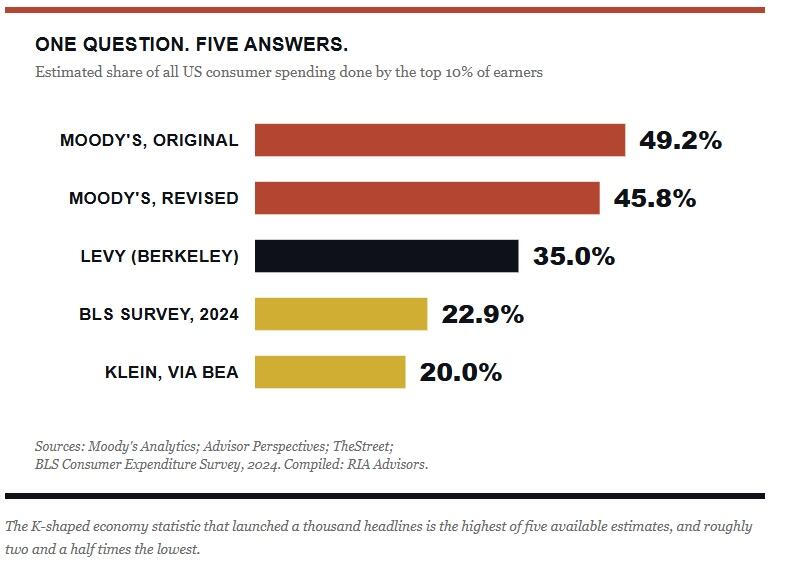
While you may think that is just economists arguing amongst themselves, it isn’t. What is crucial to note is that when the number that anchors the entire narrative varies by a factor of two depending on who computes it, that is a problem. In other words, the narrative is doing work the data cannot support. Such is the nature of a story that has outrun its evidence.
Furthermore, the perception gap runs deeper than just one statistic. In that same McKinsey survey, 56% of consumers named food as the category with the largest price increase in 2024.6 Here is why that is important. During that same period, insurance, housing, and childcare all rose faster, meaning that people are not tracking the data.
In other words, people are tracking what they hear on television and read on social media, and the two have become detached.
Where The K-Shaped Economy Headlines Are Simply Wrong
Here is where it gets interesting.
Everyone “knows” wealth concentration is worse than ever. As I laid out in my earlier piece on the K-shaped economy and why the middle class moved up, the income story runs in the opposite direction from the coverage.
The wealth story is stranger still. Pull the Federal Reserve’s Distributional Financial Accounts and compute it yourself, and the top 10% share of household net worth peaked at 70.3% in the first quarter of 2019. It sits at 67.9% today. The bottom 50% share bottomed at 0.4% in late 2011, was 1.7% at the end of 2019, and is 2.5% now.
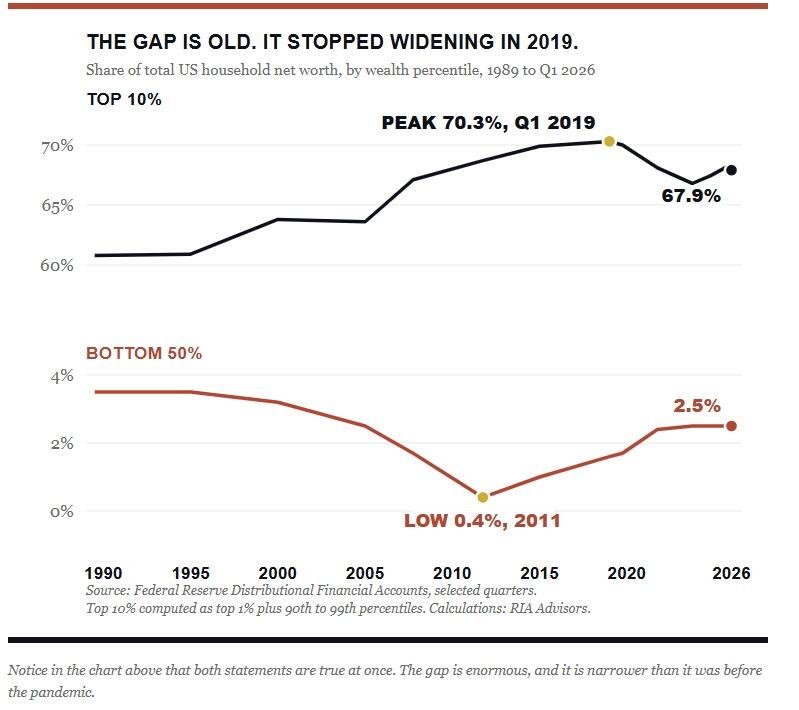
When looking at wealth concentrations, it is very easy to blame those at the top of the wealth pyramid. Yes, the top 10% of the population held a 31.8% share of economic wealth in the fourth quarter of 2025. Yet the bottom half gains since 2019 came almost entirely from the 90th to 99th percentiles, which fell from 39.7% to 36.3%. In plain English, the professional class lost relative ground, not the working class. Such is a detail that changes who you think is complaining.
Furthermore, the recovery that no one called K-shaped was far worse. Between 2007 and 2016, median wealth for the bottom 30% of families fell 31% while the top 10% fully recovered.7 Saez found the top 1% captured 91% of real income growth from 2009 to 2012. Nobody ran a K headline in 2013. The data was uglier then.
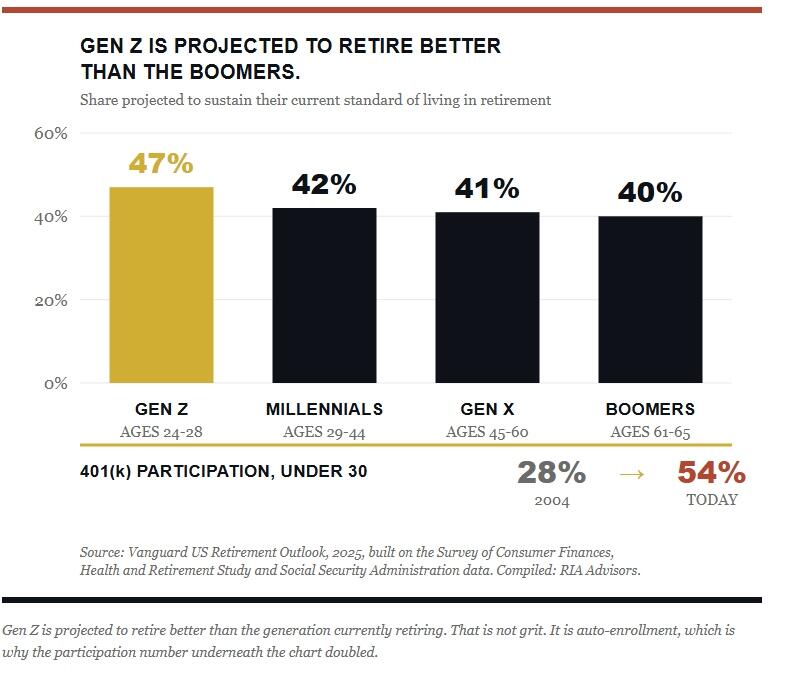
The last false claim is the one that worries me most, because young people believe it about themselves. That is the real damage the K-shaped economy headlines have done. Vanguard’s administrative records show 401(k) participation among young workers at 54%, against 28% for the same age group in 2004. Savings rates are higher, and average balances have roughly doubled.8 Vanguard’s own model puts 47% of Gen Z on track to sustain their standard of living in retirement, seven points ahead of the boomers. The problem is NOT that young people stopped saving
McKinsey found the same thing from the other direction. Adults aged 18 to 24 face the worst entry-level labor market in decades, and 34% name mental health as their top barrier, against 14% of older adults. Yet they were more likely than any other older group to say their finances will improve and that their lives have momentum.
“The generation everyone is writing eulogies for has not read them.“
Do The K-Shaped Economy Headlines Become Self-Fulfilling?
This is the question I actually wanted answered, so I went looking for the research. Does talking constantly about a K-shaped economy help create one? The answer splits cleanly in two, and almost nobody reports both halves.
At the level of the whole economy, no. The Chicago Fed published the number in June. The correlation between the Michigan sentiment index and annual real consumer spending growth ran 0.69 before 2020. Since 2020, it has been roughly zero.9 Their composite estimate says Michigan currently understates sentiment by 25 to 30 index points. About 10 of those points trace to the 2024 switch from telephone to online collection. Then there is the receipt test. A Fed study matched roughly 10,000 survey responses to verified purchase records. Some 43% said they were doing worse than in 2019. Most had actually bought more.
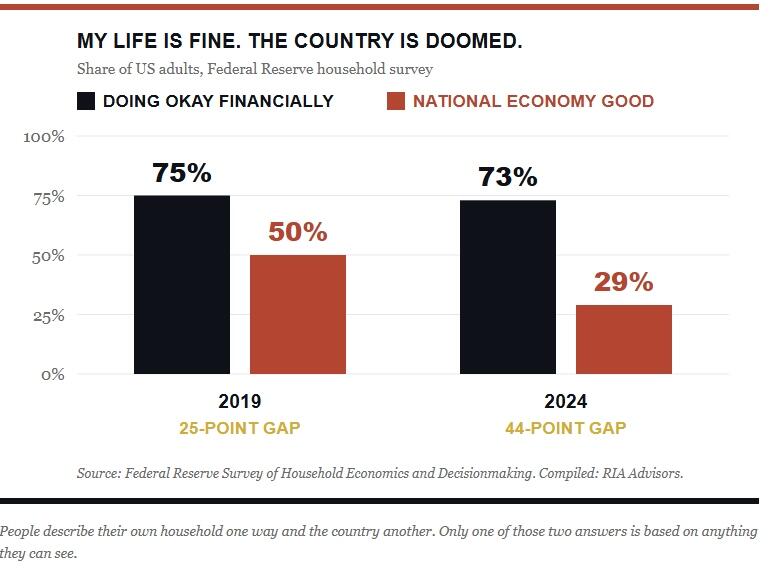
Secondly, Barsky and Sims settled the mechanism years ago: confidence is a leading indicator, not a cause.
In the economy, confidence carries information that people already have; in a survey, they respond to what they have read or seen, rather than to what they expect. This is also the structural reason why the doom loop can’t close at the macro level. Bank runs feed on themselves because if you withdraw your money, it makes my withdrawal smarter. However, in the economy, consumption lacks this property. Your neighbor skipping a vacation does nothing to make skipping yours a better idea. Such is why sentiment can collapse, and spending can increase.
At the level of one household, yes, and this is where it bites. The K-shaped economy doom loop is real. It just doesn’t run through GDP. It runs through the handful of large, irreversible decisions a person makes over a lifetime.
The clearest evidence comes from Bailey and co-authors. They matched 1.4 million Facebook users to 525,000 housing transactions, then used the house price experiences of geographically distant friends to isolate the belief channel. When distant friends saw 5 percentage points more price appreciation, a renter’s probability of buying rose 3.1 points off an 18% base.10 Beliefs picked up socially, from people nowhere near your housing market, changed whether you bought a house.
Now apply that to a young person marinating in K-shaped economy headlines. I’ve pushed back before on the lazy version of this story, the one painting a whole generation as financial nihilists. That framing is still wrong. The behavior at the margin has gotten worse anyway. Baker and colleagues at Northwestern, using transaction data on 230,000 households, found that every dollar wagered on sports betting reduces net household investment by about 99 cents.11 Not lottery spending. Not other gambling. Savings.
The damage compounds from there. New York Fed researchers found credit card delinquency rates rising 1.02 percentage points among households under 40 in states that legalized. Furthermore, separate work by UCLA and USC estimates that roughly 30,000 additional bankruptcies a year are attributable to online betting.12 The same restlessness shows up in the options tape. Zero-day contracts reached 65% of total SPX volume in May 2026. Citadel Securities reports that nearly half of all retail options volume on its platform now expires on the same day, up from 13% in 2021.
None of that is saving or investing, and it is the real culprit behind the “K-shaped economy” narrative. In other words, the narrative is driving behavior that is creating the outcome. As we documented in our work on why retail traders consistently underperform, the average retail equity investor earned 16.54% in 2024, compared with 25.02% for the index. The performance gap is due to behavior, not access.
While everyone agrees that the economy is hopeless for the young, the agreement itself is the tell.
What To Do About It
Are there problems in the economy? Yes. Let’s recap what we know.
But here is the real question to ask yourself, particularly if you “feel” like your future is hopeless.
“Do you have the ability to change your outcome?”
That answer is unequivocally – “yes.” You just have to be willing to do the work.
First, fix your benchmark. You are not competing with a stranger’s vacation photos or the top 1% of a country of 340 million people. The relevant comparison is your own plan, and whether this year moved you closer to it. Everything in thinking like an investor rather than a speculator starts there. McKinsey found Americans with strong community ties were nearly four times as likely to feel their lives have momentum. Only a third felt they were connected. Trade some screen time for the other thing.
Second, stop gambling and call it what it is. Nobody ever bet their way out of the K-shaped economy. Will a sports parlay occasionally pay off? Sure. Will it build wealth over 30 years? The data is very clear that it doesn’t. More notably, the ones betting are also the ones who can least afford it.
Third, set goals you can actually hit. The $1.46 million “magic number” that circulates every January is a survey artifact from a company that sells retirement products. It is not your number. The number you need to focus on comes from your spending, your timeline, and your obligations, which is a smaller and far more solvable problem than headlines imply.
Fourth, automate the boring parts. The reason that Gen Z is projected to retire better than the boomers is not superior discipline. It is auto-enrollment. Company 401 (k) plans that enroll workers by default have a 94% participation rate, compared with 64% for voluntary plans. Design beats willpower, every time.
On housing, I recently argued that home affordability is better than the headlines suggest, and that holds for the monthly payment burden. Harvard’s housing center set home prices near five times the median income, up from roughly three times in the 1990s. That is indeed a barrier to entry.
However, the down payment for homes today is 3% versus 20% in the 1990’s. So, yes, the payment is manageable once you’re in, but the hard part is saving up for the down payment. I get that, and here is the hard truth. If you can’t save up a 3% down payment, you have other financial problems (e.g., overspending) that you need to resolve first. The mortgage payment is one thing; the taxes, fees, maintenance, and everything else that goes with the joy of homeownership is quite another.
The K-shaped economy is real, and it is old. What changed isn’t the shape of the economy; it’s just that the media found a narrative that gets lots of clicks and views, and we let headlines do our thinking for us.
Believe the headlines, and you will make exactly the decisions that guarantee they come true for you.
* * *

Tyler Durden
Fri, 09/18/2026 – 13:40

